Solar Installation Timeline: Contract to Switch-On

United States only. Sources dated in the note at the foot of this page. This page contains no production figures, no kilowatt-hour benchmarks and no acceptable-tolerance percentage, by design.
The annual kilowatt-hour figure in a solar proposal is not a measurement. It is the output of a computer model of your roof, run by the company that wants to sell you the system, using inputs that company chose. You cannot prove that number wrong from your kitchen table, and you do not need to. What you can do is find out whether it is optimistic, and the way to do that is to ask for the inputs rather than argue about the output.
This page is about those inputs. There are six of them that move the estimate more than anything else, and none of them is on the front page of a proposal.
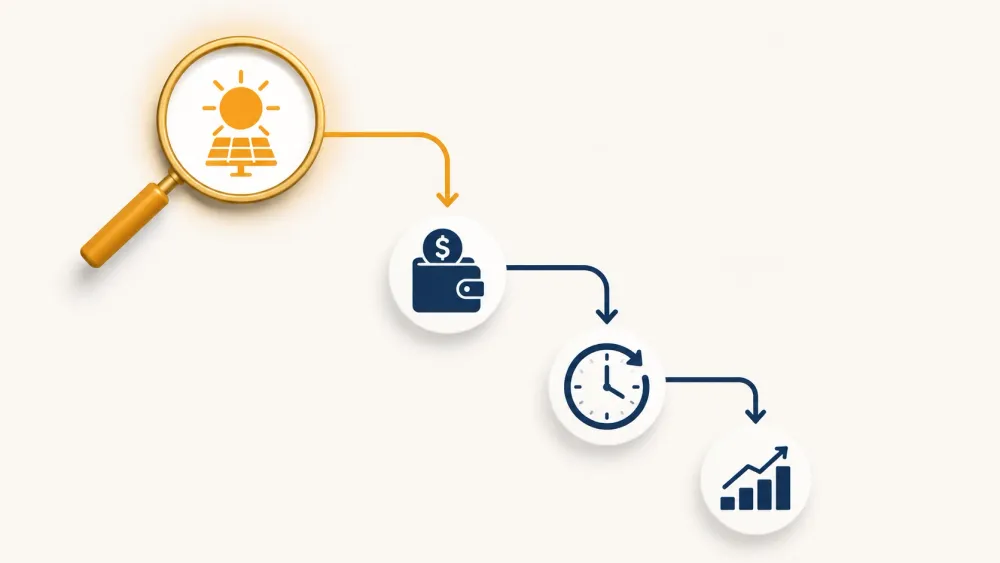
Almost every promise in the proposal is calculated downstream of it. The savings figure is production multiplied by what a kilowatt-hour is worth to you. The payback period is the price divided by those savings. A lifetime savings figure is that arithmetic repeated for twenty-five years under an assumption about future rates. A production guarantee, where one exists, is usually measured against this same estimate.
So an estimate that is ten percent optimistic does not make the proposal ten percent wrong. It moves every number downstream of it, in the same direction, at once. That is why an inflated production estimate is the most efficient way to make a mediocre proposal look good, and why it is worth twenty minutes of your attention before you look at the price.
Ask for each of these in writing. A modeling tool records all of them, so a proposal team can supply them without doing new work.
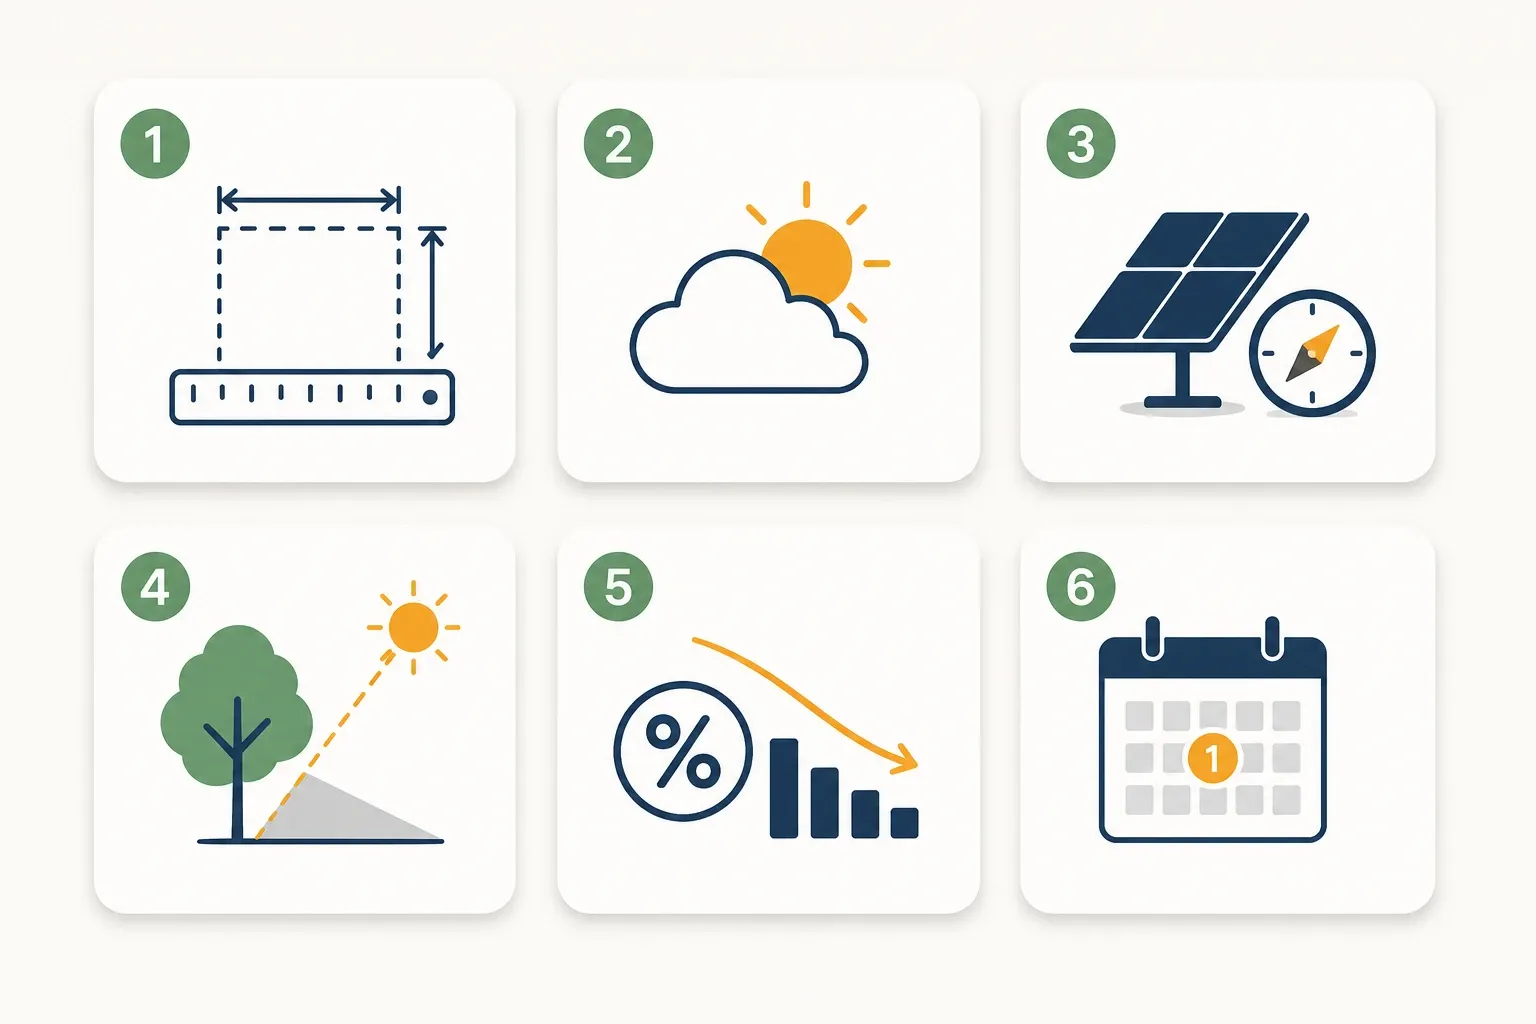
A system's size can be quoted as a DC nameplate rating, as an AC rating limited by the inverter, or implied by a panel count multiplied by a panel wattage. These are not the same figure, and production models take a size as an input. Confirm which unit the estimate was run at, and confirm it matches the system the proposal is actually selling you.
Every model uses a historical weather data set for a location near you, and models let the user choose it. Ask which data set was used and which location it represents. A site an hour away with a different microclimate is a legitimate modeling choice and it is also the sort of choice worth knowing about.
Which direction the array faces and at what angle. On a pitched roof these are usually fixed by the roof itself, so they should match your house rather than an ideal. If the proposal covers several roof planes, each plane has its own pair of numbers and its own production, and the total is the sum. Ask to see the split by plane rather than only the total.
This is where two proposals for the same house diverge most. Shading can be measured on site with a shade-analysis tool, estimated from aerial imagery, modeled from lidar data, or approximated by eye. Ask which method was used, and ask what was included. Trees grow. A neighbor's roofline does not move but a new extension might. A chimney and a vent stack shade a small area for part of the day, all year.
An estimate produced with no site-specific shading assessment at all is not necessarily dishonest, but it is a different kind of number from one produced with a measurement, and you should know which one you are holding.
Between the sunlight hitting a panel and the electricity reaching your meter there are losses: wiring, inverter conversion, soiling, temperature, mismatch, downtime. Modeling tools bundle these into a system loss figure that the user sets. It has a default and the default can be changed.
Ask what loss figure was used and whether it was left at the tool's default. We are deliberately not printing a number here for what that figure should be, because it depends on the site and the equipment, and a number invented for an article would be exactly the kind of unverified benchmark this page exists to argue against.
Panels produce slightly less each year. A proposal can show first-year production, an annual average across the assumed system life, or a year-by-year table. All three are legitimate and they are different numbers. If a savings model runs for twenty-five years, ask which degradation rate it used and where that rate comes from. The honest source for it is the equipment manufacturer's own published warranty and specification sheet, not a rule of thumb.
There is a public, free, government-published model you can run yourself. The National Renewable Energy Laboratory publishes PVWatts, a tool that estimates production for a grid-connected photovoltaic system at a given address, and the US Department of Energy's own homeowner guidance points consumers toward it. That was read and recorded for this site on August 24, 2026, and it is the same reference this site has pointed at throughout this cluster.
Run your own address with the system size from each proposal. Then compare.
Be careful about what the comparison proves. You are not trying to establish a correct answer. A public model with generic inputs is not better informed about your roof than an installer who stood on it. What you are looking for is the shape of the disagreement:
A gap is a prompt for a specific question. It is not evidence of bad faith, and treating it as evidence will get you a defensive salesperson instead of an explanation.
The proposal will also state what share of your electricity use the system is expected to cover. That claim has two halves and only one of them is modeled: the production estimate, and your annual consumption.
Your annual consumption is not a model. It is on your own utility bills, and most utilities publish twelve or twenty-four months of it inside your online account. Add it up yourself and compare it against the figure the proposal used. If the proposal assumed a consumption higher than your actual usage, the system is sized for a house you do not live in, and the coverage percentage is describing a different household.
This is the cheapest verification in the whole process because the source document is already yours.
Two reasons that are easy to miss.
First, the value of the electricity compounds the error. Savings are production multiplied by the rate you avoid paying, so an inflated kilowatt-hour count is inflated again by whatever rate assumption sits underneath it. If the model also assumes your utility rate climbs quickly, the two optimistic assumptions multiply rather than add. That interaction is worth understanding before you read any savings figure, and what your electricity actually costs you today is the foundation of it.
Second, the estimate often becomes the baseline for any performance promise attached to the system. Where a production guarantee exists, it is typically written against the modeled figure. A guarantee measured against a conservative estimate is worth something. A guarantee measured against an optimistic one has been pre-loaded to be met. What such a guarantee actually promises, and what it pays if the promise fails, is its own subject and needs the contract language rather than the brochure.
Copy this, add your address, and send it to each installer:
Seven questions, one email, and the answers are records that already exist. Whether they arrive quickly and completely is itself information about who you are dealing with, and the answers give you what you need to run the payback arithmetic on your own assumptions rather than theirs.
Every one of those appears freely on pages competing for this query. None of them was left out here by accident.
Sources. The description of PVWatts, its publisher and the US Department of Energy's consumer guidance pointing to it was verified for this site on August 24, 2026 and is carried forward here. Those pages could not be re-fetched from our tooling on August 26, 2026, which is a limitation of our own retrieval and not a statement about the publisher; treat the August 24 read as the date of record. Everything else on this page is method rather than data. No production figure, loss factor, degradation rate or tolerance threshold is stated, because none could be sourced to a primary document that applies to your roof.
Editorial note for the customer. This article has no named author or reviewer attached, and it sits in a cluster where that gap is now consistent across every recent piece. It should carry a real named person, a visible reviewed-on date and a next-review date before publication.
One email a week with new guides, tips, and solar news. Zero fluff, no sales pitch.